This is a quick blog post, mainly for my notes. In FreeBSD the users crontabs are stored in /var/cron/tabs by default. This is different than I'm used to coming from RHEL and CentOS world where crontabs where stored in /var/spool/cron/
FreeBSD Cron documentation: http://www.freebsd.org/doc/handbook/configtuning-cron.html
Showing posts with label Tools. Show all posts
Showing posts with label Tools. Show all posts
Friday, May 11, 2012


Monday, April 23, 2012
FreeBSD sed -i Error "sed: 1: "FILE": bad flag in substitute command: '.' "
On FreeBSD if you use the "-i" flag with sed you must specify a backup file. The simple fix, if you don't want a backup file is to use "" (two quotes, no space between them). You could also use any other filename you wished.
Examples:
BAD: sed -i s/192.168.1.1/192.168.1.44/g file.txt
GOOD: sed -i "" s/192.168.1.1/192.168.1.44/g file.txt
Examples:
BAD: sed -i s/192.168.1.1/192.168.1.44/g file.txt
GOOD: sed -i "" s/192.168.1.1/192.168.1.44/g file.txt
Wednesday, October 26, 2011
Using DBAN for Data Sanitation
If you're getting rid of your PC at home or retiring PCs in the office it is recommended that you first wipe the drive of any remaining bit of information. I'm not going to debate the merits of method or the other, or if this is even worth while. I'm a firm believer that 99% of the time this tool will wipe your drive and the data will be unrecoverable to most people or attacks. Personally, I run the PRNG method with 8 passes to overwrite the drives I'm getting rid of. This is on top of using secure delete methods to overwrite individual files as I delete them on my PC in day to day operations.
If you're very paranoid anyhow, you should be using something like Truecrypt to encrypt everything at rest on your hard drive, and possibly even a hidden encrypted volume inside of that. Even here, I would wipe a drive when I was done with it.
The first thing to do is to download the ISO image from dban.org/download. Then you will need to burn the ISO image to a CD. (A quick Google search should get you some results.)
Once you boot your PC with the burned image you should come to this screen.
If you hit the F2 key you will see this screen.
Hitting F3 will get you this screen.
F4 will get you to this note about RAID devices. Remember always dismantle your RAID volumes before wiping them!
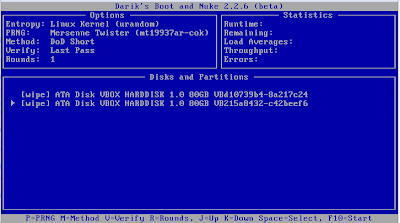
If you hit enter on the Initial Boot screen you'll end up here in Interactive Mode.
In Interactive Mode you can choose which Pseudo Random Number Generator to use. You have two choices (Mersenne Twister and ISAAC, but I go with Mersenne Twister, but apparently ISAAC is more secure.
If you need to quickly zero out a drive, such as before re-installing Microsoft Windows or for some other reason this option is for you.
Something to note, if you have multiple drives installed and selected for wipe (from Interactive Mode) they will wipe in parallel. This can speed things up significantly if you have a lot of drives to wipe
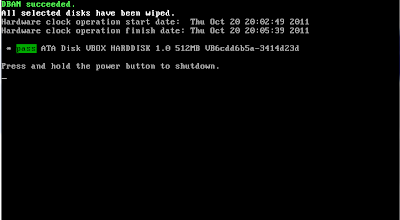
When DBAN has finished you'll come to this screen. If you don't have a Green pass next to each disk you wiped it may be a failed disk.
After running DBAN a few times you should become comfortable with the different options and what they do. I started out running in interactive mode all of the time, but now when I get to the Initial Boot Screen I simply type prng (Which used the prng method with 8 passes and verification on the last pass) and let it go to town. I only do this however on machines where I want to wipe everything. For safeties sake I always physically disconnect drives I do not want to wipe.
 |
| Initial Boot Screen |

 |
| DBAN About Page |

 |
| Quick Commands |

 |
| A message about RAID devices |

 |
| Interactive Mode |

 |
| Pseudo Random Number Generator (Mersenne Twister) explanation |

 |
| Pseudo Random Number Generator (ISAAC) explanation |

 |
| Wipe Method (Quick Erase explanation) |

 |
| Wipe Method (RCMP TSSIT OPS-II explanation) |

 |
| Wipe Method (DoD Short explanation) |

 |
| Wipe Method (DoD 5220.22-M explanation) |

 |
| Wipe Method (Gutmann Wipe explanation) |

 |
| Wipe Method (PRNG Stream explanation) |

 |
| Verification Mode (Verification Off Explanation) |

 |
| Verification Mode (Verification Last Pass Explanation) |

 |
| Verification Mode (Verification All Passes Explanation) |

 |
| Changing the number of rounds |

 |
| Running in parallel |

 |
| All Done! |

After running DBAN a few times you should become comfortable with the different options and what they do. I started out running in interactive mode all of the time, but now when I get to the Initial Boot Screen I simply type prng (Which used the prng method with 8 passes and verification on the last pass) and let it go to town. I only do this however on machines where I want to wipe everything. For safeties sake I always physically disconnect drives I do not want to wipe.
Friday, October 21, 2011
Installing and Configuring ZendServer Community Edition (CE) on CentOS 5 / 6
The quick and the dirty:
Download the Zend Server (DEB/RPM Installer Script) from zend.com. (An account is required).
un-pack the the tarball (tar -xzfv ZendServer-5.5.0-RepositoryInstaller-linux.tar.gz)
Run ./install_zs.sh 5.3 ce or ./install_zs.sh 5.2 ce depending on which version of PHP you want to run.
Edit your iptables (you are running iptables right?) vi /etc/sysconfig/iptables
Add in a line for the ZendServer lighthttpd server (-A INPUT -m state --state NEW -m tcp -p tcp --dport 10081 -j ACCEPT)
Restart iptables (/sbin/service iptables restart)
Visit (http://YOURSERVERHERE.com:10081/ZendServer/) in a web browser to accept the EULA and set a password.
Alternatively run (/usr/local/zend/bin/zs-setup accept-eula) and (/usr/local/zend/bin/zs-setup set-password YOURSECUREPASSWORD )
If you need to restart Zend Server run /sbin/service zend-server restart. This will restart both apache (httpd) and the LightHTTPD Zend Server gui.
Some important notes before heading off into the wonderful world of Zend Server:
Be sure that your distribution's PHP isn't installed as well as the Zend Server, including the CLI, as it will mess with running php from the command line and who knows what else.
The php binary is located at /usr/local/zend/bin/php, which can be verified by running which php. As such if you need to run php from cron be sure to add this to your path. (I have PATH=$PATH:$HOME/bin:/usr/local/zend/bin in my ~/.bash_profile).
If you need to modify a setting in php.ini you will find it at /usr/local/zend/etc/php.ini. Remember to restart zend server for any changes to take effect.
Beyond those things there isn't too much difference between running zend server and running php from your distribution.
Some important notes before heading off into the wonderful world of Zend Server:
Be sure that your distribution's PHP isn't installed as well as the Zend Server, including the CLI, as it will mess with running php from the command line and who knows what else.
The php binary is located at /usr/local/zend/bin/php, which can be verified by running which php. As such if you need to run php from cron be sure to add this to your path. (I have PATH=$PATH:$HOME/bin:/usr/local/zend/bin in my ~/.bash_profile).
If you need to modify a setting in php.ini you will find it at /usr/local/zend/etc/php.ini. Remember to restart zend server for any changes to take effect.
Beyond those things there isn't too much difference between running zend server and running php from your distribution.
Thursday, October 20, 2011
uCertify 117-101 Junior Level Linux Professional-I review
Recently, the folks at uCertify requested I review one of their certification test suites.
In my past experiences with certifications I've used a variety of study material, including instructor led classes, books, as well as electronic tools similar to those offered by uCertify.
I prefer instructor led classes, but a mix of books and electronic tools are also a viable option for me.
The uCertify catalog includes a wide variety of test preparation kits for a number of popular certifications, including: LPIC, Cisco, Zend, Linux, Microsoft, etc. Given I am currently in the process of studying for my LPIC-1, I selected the Junior Level Linux Professional (LPIC-1) track, which provided me access to the 117-101 Junior Level Linux Professional-I preparation kit.
I was able to install the software quickly and easily without any problems. The activation was also painless, which I expected.
To start out, the tool offers a variety of teaching tools including study notes and practice quizzes, which is what I was really looking forward to. Each of the components is easy to use and follow, although the navigation confused me a bit at first.
The content itself seems accurate. Much of it appears to be snippets of relevant text from the official Linux man pages, with some text with a degree less of technical jargon to it to further explain the topic at hand. There where some areas where the content was a little lacking, but it didn't happen too often.
The practice tests themselves are pretty good. They relate directly to the study material and are worded such that they are easy to comprehend. They also have the same cadence and tone that are on the actual tests.
A couple of nice features that stood out from other tools I have used in the past include the ability to select different test modes and creating custom tests. In addition, within the test itself, the ability to add notes, print items and even provide feedback are all quite helpful. Of course, it also contains other expected features such as bookmarking of questions and a summary of answers for final review prior to submitting for results. The test experience itself was quite good and provided simple methods for reviewing the results and furthering one's understanding of the subject.
Without the benefit of having taken the official exam, it is also a bit difficult to gauge the usefulness of other features such as the Test Readiness Report and Objective Readiness Report, both of which are aimed at providing insight as to how well one might perform on the official test.
Overall, the uCertify tool is a comprehensive and flexible learning tool that is definitely worth considering, specially at the $80 - $100 price point (depends on selected test). Those looking for self-paced preparation kits will find it easy to use, thorough and extremely helpful.
TL;DR
Simple installation
Good Price point
Relevant study material
Comprehensive set of tools
Different learning techniques for varying preferences
Flexible practice tests
uCertify test preparation kits are available at: www.ucertify.com
Tuesday, October 11, 2011
Logmein Hamachi - Hub and Spoke Network
This is going to be another quick one, mainly so I remember how to change which computer is a hub and which computer is a spoke.
In "My Networks", click on "Edit" in the desired network. Then click the link "Add/Remove members" and there you can set the Hub/Spoke radio button.
That's it!
In "My Networks", click on "Edit" in the desired network. Then click the link "Add/Remove members" and there you can set the Hub/Spoke radio button.
That's it!
Tuesday, September 27, 2011
System Activity Report (sar) and You
sar is an acronym for System Activity Report. It takes a snapshot of the system periodically. On most distributions it comes with the sysstat package. On Redhat and derived distributions the package will install a set of cron jobs in /etc/cron.d/sysstat. There are two cron jobs to take note of. The first one runs every ten minutes as root. It runs the script /usr/lib/sa/sa1 -S Disk 1 1. This script saves its output in report files. The files are written to /var/log/sa/sar[dd], where [dd] is the two digit date for today's date. (e.g. Today is 8/26/2011. The log file is /var/log/sa/sar26)
The second cron job runs at 23:53. This cron job summarizes the days activity. Both of the reports are saved as binary data, so normal tools are useless here.
There are many flags to use with sar when running it interactivly. Some of the flags have additional atguments that are required when used. One example of thses flags is -n which al requires an additional argement suach as DEV or NFS ro IP. This specific example has eightteen (18) potential arguments, not including ALL.
With sar liberal use of the man pages are highly suggested. Not only are the flags and any arguments documented, but the headers for each one and what they represent are explained as well. This comes in handy if you get overzealous with flags and aren't quite sure what you're looking at.
I'm only going to cover some of the most notable flags, what they show and their headers. Be careful however as some flags exist in both upper and lower case and report vastly different metrics. One example of the is -b which reports on I/O transfer but -B reports on paging stats.
First off the plate is -b which as I've already stated reports on I/O transfer stats and has the following headers:
tps: Transfers per second to a physical device.
rtps: Read transfers per second to a physical device.
wtps: Write transfers per second to a physical device.
bread/s: Blocks (since kernel 2.4 = sectors = 512 bytes) read from devices per second.
bwrtn/s: Blocks written to devices per second.
Example output from a production server running: sar -b 1 1
Linux 2.6.18-274 el5PAE (server.domain.com) 8/26/2011
09:23:57 PM tps rtps wtps bread/s bwrtn/s
09:23:58 PM 7829.00 133.00 7696.00 1528.00 76960.00
Average: 7829.00 133.00 7696.00 1528.00 76960.00
-B will report paging stats. Some metrics / headers are only available in kernels 2.5 and newer.
pgpgin/s: Kilobytes paged in from disk per second.
pgpgout/s: Kilobytes paged out from disk per second.
magflt/s: Major faults per second (hits to disk, this is a bad thing...)
-c Process creation stats.
proc/s: Processes created per second.
-d Activity for each block device.
tps: Transfers per second
rd_sec/s: Sectors (512 bytes) read from block device per second.
wr_sec/s: Sectors (512 bytes) written to block device per second.
avgrq-sz: Average # of sectors
avgqu-sz: Average queue length
await: Average time in milliseconds for queue + servicing request.
svctm: Average servicing time.
%util: CPU percentage while I/O requests where issued. Close to 100% = device saturation.
-n DEV Network interface stats.
IFACE: Interface Name
rxpck/s: Packets received per second.
tcpck/s: Packets sent per second.
rxbyt/s: Bytes received per second.
txbyt/s: Bytes sent per second.
rxcmp/s: Compressed packets received per second.
txcmp/s: Compressed packets sent per second.
rxmcst/s: Multicast packets received per second.
-P ALL Per processor (or core) stats
-p Print pretty device names
Shows block devices as sda instead of dev8-0. Has no effect on Network device names.
-A same as: -bBcdqrRuvwWy -I SUM -I XALL -n ALL -P ALL
After you install the sysstat package you really need to let it run for a while and gather stats to see the real beauty of it all. However you can run it interactively if required. When running sar interactively the syntax is sar -FLAGS Interval Duration. (e.g. sar -b 2 60) runs I/O stats every two seconds for a minute. This is very hand to run if you're troubleshooting a slow system or watching it under load.
The second cron job runs at 23:53. This cron job summarizes the days activity. Both of the reports are saved as binary data, so normal tools are useless here.
There are many flags to use with sar when running it interactivly. Some of the flags have additional atguments that are required when used. One example of thses flags is -n which al requires an additional argement suach as DEV or NFS ro IP. This specific example has eightteen (18) potential arguments, not including ALL.
With sar liberal use of the man pages are highly suggested. Not only are the flags and any arguments documented, but the headers for each one and what they represent are explained as well. This comes in handy if you get overzealous with flags and aren't quite sure what you're looking at.
I'm only going to cover some of the most notable flags, what they show and their headers. Be careful however as some flags exist in both upper and lower case and report vastly different metrics. One example of the is -b which reports on I/O transfer but -B reports on paging stats.
First off the plate is -b which as I've already stated reports on I/O transfer stats and has the following headers:
tps: Transfers per second to a physical device.
rtps: Read transfers per second to a physical device.
wtps: Write transfers per second to a physical device.
bread/s: Blocks (since kernel 2.4 = sectors = 512 bytes) read from devices per second.
bwrtn/s: Blocks written to devices per second.
Example output from a production server running: sar -b 1 1
Linux 2.6.18-274 el5PAE (server.domain.com) 8/26/2011
09:23:57 PM tps rtps wtps bread/s bwrtn/s
09:23:58 PM 7829.00 133.00 7696.00 1528.00 76960.00
Average: 7829.00 133.00 7696.00 1528.00 76960.00
-B will report paging stats. Some metrics / headers are only available in kernels 2.5 and newer.
pgpgin/s: Kilobytes paged in from disk per second.
pgpgout/s: Kilobytes paged out from disk per second.
magflt/s: Major faults per second (hits to disk, this is a bad thing...)
-c Process creation stats.
proc/s: Processes created per second.
-d Activity for each block device.
tps: Transfers per second
rd_sec/s: Sectors (512 bytes) read from block device per second.
wr_sec/s: Sectors (512 bytes) written to block device per second.
avgrq-sz: Average # of sectors
avgqu-sz: Average queue length
await: Average time in milliseconds for queue + servicing request.
svctm: Average servicing time.
%util: CPU percentage while I/O requests where issued. Close to 100% = device saturation.
-n DEV Network interface stats.
IFACE: Interface Name
rxpck/s: Packets received per second.
tcpck/s: Packets sent per second.
rxbyt/s: Bytes received per second.
txbyt/s: Bytes sent per second.
rxcmp/s: Compressed packets received per second.
txcmp/s: Compressed packets sent per second.
rxmcst/s: Multicast packets received per second.
-P ALL Per processor (or core) stats
-p Print pretty device names
Shows block devices as sda instead of dev8-0. Has no effect on Network device names.
-A same as: -bBcdqrRuvwWy -I SUM -I XALL -n ALL -P ALL
After you install the sysstat package you really need to let it run for a while and gather stats to see the real beauty of it all. However you can run it interactively if required. When running sar interactively the syntax is sar -FLAGS Interval Duration. (e.g. sar -b 2 60) runs I/O stats every two seconds for a minute. This is very hand to run if you're troubleshooting a slow system or watching it under load.
Monday, September 26, 2011
Changing the from e-mail address in Nagios
This is going to be another short one. I recently had a need to change the FROM address for e-mail from our Nagios installation. E-mail was coming from nagios@host.domain.com, which is non-route-able from outside our network.
The change is very simple. Change the two command lines in your Nagios commands.cfg dealing with notify by e-mail. The command names are "notify-host-by-email" and "notify-service-by-email".
By default these lines read:
/usr/bin/printf "%b" "***** Nagios *****\n\nNotification Type: $NOTIFICATIONTYPE$\nHost: $HOSTNAME$\nState: $HOSTSTATE$\nAddress: $HOSTADDRESS$\nInfo: $HOSTOUTPUT$\n\nDate/ Time: $LONGDATETIME$\n" | /bin/mail -s "** $NOTIFICATIONTYPE$ Host Alert: $HOSTNAME$ is $HOSTSTATE$ **" $CONTACTEMAIL$
and
/usr/bin/printf "%b" "***** Nagios *****\n\nNotification Type: $NOTIFICATIONTYPE$\n\nService: $SERVICEDESC$\nHost: $HOSTALIAS$\nAddress: $HOSTADDRESS$\nState: $SERVICESTATE $\n\nDate/Time: $LONGDATETIME$\n\nAdditional Info:\n\n$SERVICEOUTPUT$" | /bin/mail -s "** $NOTIFICATIONTYPE$ Service Alert: $HOSTALIAS$/$SERVICEDESC$ is $SERVICESTATE$ **" $CONTACTEMAIL$
To change the from address you append " -- -f nagios@domain.com", that is without the quotes of course. So the new lines look like:
/usr/bin/printf "%b" "***** Nagios *****\n\nNotification Type: $NOTIFICATIONTYPE$\nHost: $HOSTNAME$\nState: $HOSTSTATE$\nAddress: $HOSTADDRESS$\nInfo: $HOSTOUTPUT$\n\nDate/ Time: $LONGDATETIME$\n" | /bin/mail -s "** $NOTIFICATIONTYPE$ Host Alert: $HOSTNAME$ is $HOSTSTATE$ **" $CONTACTEMAIL$ -- -f nagios@domain.com
and
/usr/bin/printf "%b" "***** Nagios *****\n\nNotification Type: $NOTIFICATIONTYPE$\n\nService: $SERVICEDESC$\nHost: $HOSTALIAS$\nAddress: $HOSTADDRESS$\nState: $SERVICESTATE $\n\nDate/Time: $LONGDATETIME$\n\nAdditional Info:\n\n$SERVICEOUTPUT$" | /bin/mail -s "** $NOTIFICATIONTYPE$ Service Alert: $HOSTALIAS$/$SERVICEDESC$ is $SERVICESTATE$ **" $CONTACTEMAIL$ -- -f nagios@domain.com
To explain it a little what we appended was a space followed by two dashes, which forces mail to pass those along to sendmail. Send mails sees the addition of a dash followed by the letter f and then another space and the e-mail address you want to send from.
On my system this is an alias for myself so that all replies come to my inbox.
All of this works on CentOS which is what I'm currently running. It should work on other distributions as well, but I haven't the time to verify that.
The change is very simple. Change the two command lines in your Nagios commands.cfg dealing with notify by e-mail. The command names are "notify-host-by-email" and "notify-service-by-email".
By default these lines read:
/usr/bin/printf "%b" "***** Nagios *****\n\nNotification Type: $NOTIFICATIONTYPE$\nHost: $HOSTNAME$\nState: $HOSTSTATE$\nAddress: $HOSTADDRESS$\nInfo: $HOSTOUTPUT$\n\nDate/ Time: $LONGDATETIME$\n" | /bin/mail -s "** $NOTIFICATIONTYPE$ Host Alert: $HOSTNAME$ is $HOSTSTATE$ **" $CONTACTEMAIL$
and
/usr/bin/printf "%b" "***** Nagios *****\n\nNotification Type: $NOTIFICATIONTYPE$\n\nService: $SERVICEDESC$\nHost: $HOSTALIAS$\nAddress: $HOSTADDRESS$\nState: $SERVICESTATE $\n\nDate/Time: $LONGDATETIME$\n\nAdditional Info:\n\n$SERVICEOUTPUT$" | /bin/mail -s "** $NOTIFICATIONTYPE$ Service Alert: $HOSTALIAS$/$SERVICEDESC$ is $SERVICESTATE$ **" $CONTACTEMAIL$
To change the from address you append " -- -f nagios@domain.com", that is without the quotes of course. So the new lines look like:
/usr/bin/printf "%b" "***** Nagios *****\n\nNotification Type: $NOTIFICATIONTYPE$\nHost: $HOSTNAME$\nState: $HOSTSTATE$\nAddress: $HOSTADDRESS$\nInfo: $HOSTOUTPUT$\n\nDate/ Time: $LONGDATETIME$\n" | /bin/mail -s "** $NOTIFICATIONTYPE$ Host Alert: $HOSTNAME$ is $HOSTSTATE$ **" $CONTACTEMAIL$ -- -f nagios@domain.com
and
/usr/bin/printf "%b" "***** Nagios *****\n\nNotification Type: $NOTIFICATIONTYPE$\n\nService: $SERVICEDESC$\nHost: $HOSTALIAS$\nAddress: $HOSTADDRESS$\nState: $SERVICESTATE $\n\nDate/Time: $LONGDATETIME$\n\nAdditional Info:\n\n$SERVICEOUTPUT$" | /bin/mail -s "** $NOTIFICATIONTYPE$ Service Alert: $HOSTALIAS$/$SERVICEDESC$ is $SERVICESTATE$ **" $CONTACTEMAIL$ -- -f nagios@domain.com
To explain it a little what we appended was a space followed by two dashes, which forces mail to pass those along to sendmail. Send mails sees the addition of a dash followed by the letter f and then another space and the e-mail address you want to send from.
On my system this is an alias for myself so that all replies come to my inbox.
All of this works on CentOS which is what I'm currently running. It should work on other distributions as well, but I haven't the time to verify that.
Tuesday, September 20, 2011
Powershell Get-ChildItem Count 1 result
This is going to be a quick one. I'm working on a new Powershell script (my second) and I'm doing some sanity checks before I actually try to continue the workflow.
If you run the command below and it returns only one item and then either try to print out $fileCount or run an if statement or something against it like if ($fileCount -gt 0){do some stuff} the "do some stuff" won't happen.
#$fileCount = $(get-childitem C:\ -filter *.zip).count
This is because the count method returns an array, which if only one item is in it doesn't get created and thus is 0. To get around this you must create the array first. You can do this in the same line of code as shown below.
#$fileCount = @(get-childitem C:\ -filter *.zip).count
The at sign there will create the array and you will have one item in it.
If you run the command below and it returns only one item and then either try to print out $fileCount or run an if statement or something against it like if ($fileCount -gt 0){do some stuff} the "do some stuff" won't happen.
#$fileCount = $(get-childitem C:\ -filter *.zip).count
This is because the count method returns an array, which if only one item is in it doesn't get created and thus is 0. To get around this you must create the array first. You can do this in the same line of code as shown below.
#$fileCount = @(get-childitem C:\ -filter *.zip).count
The at sign there will create the array and you will have one item in it.
Tuesday, September 13, 2011
File Checksum Integrity Verifier utility or SHA1 / MD5 checksum utility for Windows
On Linux if you need to verify the file you just downloaded is untouched you run either sha1sum or md5sum on the file to get the checksum and verify it against the published checksum. There are some utilities available for Windows, but today I'm going to point the spotlight at a Microsoft offering, File Checksum Integrity Verifier or fciv for short. You can grab the download from Microsoft's site.
There are a few options available when you run the command, such as -md5 to get the md5 checksum of a file or -sha1 to get the sha1 checksum of a file. But you can also use the -both flag to get both checksums of a given file. You can even create you own database of checksums to verify the files later.
To generate the checksums and store them in the database (xml file) run:
>fciv -both -xml fcdatabase.xml filetocheck.txt
The command above will obviously store both checksums and on a large file could take a while to run, as it needs to run twice on the file, once for the sha1 sum and once for the md5 sum. You of course can use one or the other check sum algorithm if you prefer (I prefer sha1 for the time being).
To later verify a file against the database you run the command shown below:
>fciv -sha1 -xml fcdatabase.xml filetocheck.txt
Now if you make changes to filetocheck.txt and run the command below you will see that verifying the file against the database it has changed. If this where an executable it may either be corrupt or compromised. If it was the project you've been working on for weeks, now is a good time to restore from backup, if the change wasn't expected of course.
>fciv -v -xml fcdatabase.xml filetocheck.txt
You'll see something like:
c:\users\mymcp\fcdatabase.xml
Hash is : 48a5967227b85c6805f3210832a155da
It should be : 04518689efadfdf2393b533dc9c7c8b5
My only real complaint is that fciv doesn't show any sort of progress while processing a large directory. It would be nice to see a file names flying by the screen or something. All in all though this is a tool worth checking out if you run Windows and don't have another tool already in your arsenal.
I would like to know if any of you have a tool in your arsenal already for this purpose and what it is / where I can find it. Sadly I don't recall any of the tools I've used in the past, but this one may become my tool of choice for this job.
There are a few options available when you run the command, such as -md5 to get the md5 checksum of a file or -sha1 to get the sha1 checksum of a file. But you can also use the -both flag to get both checksums of a given file. You can even create you own database of checksums to verify the files later.
To generate the checksums and store them in the database (xml file) run:
>fciv -both -xml fcdatabase.xml filetocheck.txt
The command above will obviously store both checksums and on a large file could take a while to run, as it needs to run twice on the file, once for the sha1 sum and once for the md5 sum. You of course can use one or the other check sum algorithm if you prefer (I prefer sha1 for the time being).
To later verify a file against the database you run the command shown below:
>fciv -sha1 -xml fcdatabase.xml filetocheck.txt
Now if you make changes to filetocheck.txt and run the command below you will see that verifying the file against the database it has changed. If this where an executable it may either be corrupt or compromised. If it was the project you've been working on for weeks, now is a good time to restore from backup, if the change wasn't expected of course.
>fciv -v -xml fcdatabase.xml filetocheck.txt
You'll see something like:
c:\users\mymcp\fcdatabase.xml
Hash is : 48a5967227b85c6805f3210832a155da
It should be : 04518689efadfdf2393b533dc9c7c8b5
My only real complaint is that fciv doesn't show any sort of progress while processing a large directory. It would be nice to see a file names flying by the screen or something. All in all though this is a tool worth checking out if you run Windows and don't have another tool already in your arsenal.
I would like to know if any of you have a tool in your arsenal already for this purpose and what it is / where I can find it. Sadly I don't recall any of the tools I've used in the past, but this one may become my tool of choice for this job.
Tuesday, April 12, 2011
Comparing ext3 to ext4 benchmarks
Below is the output from bonnie++, installed from rpmforge on CentOS 5.5, running against a RAID 0 (Linux Software RAID) of two Seagate Barracuda LP ST32000542AS, formatted with ext3.
#bonnie++ -d /mnt/SOMEDRIVE -n 32:64:4:4 -q | bon_csv2html > /StorageServer/RAID0.ext3.html


#bonnie++ -d /mnt/SOMEDRIVE -n 32:64:4:4 -q | bon_csv2html > /StorageServer/RAID0.ext3.html

Here is the same command but running on the same server, but this time running CentOS 5.6 with the same Linux software RAID 0 on two Seagate Barracuda LP ST32000542AS, but formatted with ext4.

We can see that Sequential Output Per Character is slightly higher, Block K/Sec is higher and with significantly lower latency, but Rewrite is lower and with higher latency on ext4. (Higher is better)
Sequential input on both Per Caharacter and Block K/Sec is also slightly higher and with lower latency on ext 4. Random seeks are also slightly higher on ext4. (Higher is better)
Sequential creates are higher, but require more CPU, while Sequential Reads are lower using about the same CPU. Sequential Deletes are also slower on ext4 than they where on ext3.
Where ext4 really seems to shine is on the Random Create section. Creating random files almost doubled per second on ext4 vs. ext3, all while using similar CPU. Random Reads where so fast on ext4 that I need to retest to get accurate results (shown by +++++ on the results). Random Deletes where about 25% faster on ext4 when compared to ext3 again while using less CPU, though not by much (1%).
Now these being benchmarks they give a nice indication about what kinds of performance I may be able to have, but I need to do real world testing. Hopefully I have some meaningful results after I finish upgrading all of my servers and filesystems. I will also benchmark our RAID 5 system before and after the conversion.
For our purposes it appears that ext4 is the better filesystem given our setup and procedures.
Sequential input on both Per Caharacter and Block K/Sec is also slightly higher and with lower latency on ext 4. Random seeks are also slightly higher on ext4. (Higher is better)
Sequential creates are higher, but require more CPU, while Sequential Reads are lower using about the same CPU. Sequential Deletes are also slower on ext4 than they where on ext3.
Where ext4 really seems to shine is on the Random Create section. Creating random files almost doubled per second on ext4 vs. ext3, all while using similar CPU. Random Reads where so fast on ext4 that I need to retest to get accurate results (shown by +++++ on the results). Random Deletes where about 25% faster on ext4 when compared to ext3 again while using less CPU, though not by much (1%).
Now these being benchmarks they give a nice indication about what kinds of performance I may be able to have, but I need to do real world testing. Hopefully I have some meaningful results after I finish upgrading all of my servers and filesystems. I will also benchmark our RAID 5 system before and after the conversion.
For our purposes it appears that ext4 is the better filesystem given our setup and procedures.
Monday, April 11, 2011
Converting an ext3 filesystem to ext4 on CentOS 5.6
If you recently installed CentOS 5.6 or updated to CentOS 5.6 you can now utilize the ext4 filesystem.
To do the conversion or create a new ext4 filesystem you need the e4fsprogs tool kit from yum.
#yum -y install e4fsprogs
I did this conversion on a test system with a non-root filesystem to avoid any possible problems. I also backed up the filesystem just in case something went terribly wrong.
First you need to un-mount the filesystem, as it cannot be in use.
#cd /; umount /dev/VolGroup00/LogVol00
Now you can run the tune4fs command to convert the filesystem to ext4.
#tune4fs -O extents,uninit_bg,dir_index /dev/VolGroup00/LogVol00
Now that the filesystem is ext4 it is no longer able to be mounted as ext3, so change its entry in the fstab.
#vi /etc/fstab
Now because we used the option uninit_bg we need to run fsck on the new ext4 filesystem. This is a good idea to do anyways, but is a requirement here.
#e4fsck -fDC0 /dev/VolGroup00/LogVol00
e4fsck will complain about "One or more block group descriptor checksums are invalid", this is totally normal.
Before doing these steps on the root filesystem (/) I would recommend you read over the Ext4 Howto on kernel.org. I re-wrote the steps for more accurate information pertaining specifically to CentOS 5.6 and my system.
As always:
THE INFORMATION IS DISTRIBUTED IN THE HOPE THAT IT WILL BE USEFUL, BUT WITHOUT ANY WARRANTY. IT IS PROVIDED "AS IS" WITHOUT WARRANTY OF ANY KIND, EITHER EXPRESSED OR IMPLIED, INCLUDING, BUT NOT LIMITED TO, THE IMPLIED WARRANTIES OF MERCHANTABILITY AND FITNESS FOR A PARTICULAR PURPOSE. THE ENTIRE RISK AS TO THE QUALITY AND PERFORMANCE OF THE PROGRAM IS WITH YOU. SHOULD THE INFORMATION PROVE DEFECTIVE, YOU ASSUME THE COST OF ALL NECESSARY SERVICING, REPAIR OR CORRECTION.
IN NO EVENT UNLESS REQUIRED BY APPLICABLE LAW THE AUTHOR WILL BE LIABLE TO YOU FOR DAMAGES, INCLUDING ANY GENERAL, SPECIAL, INCIDENTAL OR CONSEQUENTIAL DAMAGES ARISING OUT OF THE USE OR INABILITY TO USE THE PROGRAM (INCLUDING BUT NOT LIMITED TO LOSS OF DATA OR DATA BEING RENDERED INACCURATE OR LOSSES SUSTAINED BY YOU OR THIRD PARTIES OR A FAILURE OF THE INFORMATION TO OPERATE WITH ANY OTHER PROGRAMS), EVEN IF THE AUTHOR HAS BEEN ADVISED OF THE POSSIBILITY OF SUCH DAMAGES.
To do the conversion or create a new ext4 filesystem you need the e4fsprogs tool kit from yum.
#yum -y install e4fsprogs
I did this conversion on a test system with a non-root filesystem to avoid any possible problems. I also backed up the filesystem just in case something went terribly wrong.
First you need to un-mount the filesystem, as it cannot be in use.
#cd /; umount /dev/VolGroup00/LogVol00
Now you can run the tune4fs command to convert the filesystem to ext4.
#tune4fs -O extents,uninit_bg,dir_index /dev/VolGroup00/LogVol00
Now that the filesystem is ext4 it is no longer able to be mounted as ext3, so change its entry in the fstab.
#vi /etc/fstab
Now because we used the option uninit_bg we need to run fsck on the new ext4 filesystem. This is a good idea to do anyways, but is a requirement here.
#e4fsck -fDC0 /dev/VolGroup00/LogVol00
e4fsck will complain about "One or more block group descriptor checksums are invalid", this is totally normal.
Before doing these steps on the root filesystem (/) I would recommend you read over the Ext4 Howto on kernel.org. I re-wrote the steps for more accurate information pertaining specifically to CentOS 5.6 and my system.
As always:
THE INFORMATION IS DISTRIBUTED IN THE HOPE THAT IT WILL BE USEFUL, BUT WITHOUT ANY WARRANTY. IT IS PROVIDED "AS IS" WITHOUT WARRANTY OF ANY KIND, EITHER EXPRESSED OR IMPLIED, INCLUDING, BUT NOT LIMITED TO, THE IMPLIED WARRANTIES OF MERCHANTABILITY AND FITNESS FOR A PARTICULAR PURPOSE. THE ENTIRE RISK AS TO THE QUALITY AND PERFORMANCE OF THE PROGRAM IS WITH YOU. SHOULD THE INFORMATION PROVE DEFECTIVE, YOU ASSUME THE COST OF ALL NECESSARY SERVICING, REPAIR OR CORRECTION.
IN NO EVENT UNLESS REQUIRED BY APPLICABLE LAW THE AUTHOR WILL BE LIABLE TO YOU FOR DAMAGES, INCLUDING ANY GENERAL, SPECIAL, INCIDENTAL OR CONSEQUENTIAL DAMAGES ARISING OUT OF THE USE OR INABILITY TO USE THE PROGRAM (INCLUDING BUT NOT LIMITED TO LOSS OF DATA OR DATA BEING RENDERED INACCURATE OR LOSSES SUSTAINED BY YOU OR THIRD PARTIES OR A FAILURE OF THE INFORMATION TO OPERATE WITH ANY OTHER PROGRAMS), EVEN IF THE AUTHOR HAS BEEN ADVISED OF THE POSSIBILITY OF SUCH DAMAGES.
Wednesday, February 09, 2011
Strange Nagios Error Solved
This morning I added some new services to a server, but they wouldn't move out of "Pending" status. The error I received was
"Feb 9 09:27:36 nagios: Warning: Check result queue contained results for service '' on host '', but the service could not be found! Perhaps you forgot to define the service in your config files?"
I stopped the nagios service and ran ps -ef | grep nagios. To my surprise there was still a Nagios instance running. This means two things. First the init script that comes with Nagios is borked and doesn't correctly check for running nagios instances. Second, I somehow started a second Nagios instance.
I thought something was up in the first place because every other refresh or so of the Nagios web view I would either see the three pending services or I wouldn't. This was my first clue that something was borked. I then went to tail /var/log/messages and saw the error message. Then I started investigating the issue with the help of Google. Once I saw that there where two instances of Nagios things started to make sense.
I killed the second Nagios instance and any children processes (in my case ndo2db) and then restarted nagios via the init script.
Once I had everything up and running (but only one instance) I was able to successfully check my new services.
"Feb 9 09:27:36
I stopped the nagios service and ran ps -ef | grep nagios. To my surprise there was still a Nagios instance running. This means two things. First the init script that comes with Nagios is borked and doesn't correctly check for running nagios instances. Second, I somehow started a second Nagios instance.
I thought something was up in the first place because every other refresh or so of the Nagios web view I would either see the three pending services or I wouldn't. This was my first clue that something was borked. I then went to tail /var/log/messages and saw the error message. Then I started investigating the issue with the help of Google. Once I saw that there where two instances of Nagios things started to make sense.
I killed the second Nagios instance and any children processes (in my case ndo2db) and then restarted nagios via the init script.
Once I had everything up and running (but only one instance) I was able to successfully check my new services.
Thursday, December 30, 2010
ImageMagick convert -geometry weirdness
I don't know if this is really documented anywhere, but when using the ImageMagick program convert with the -geometry or -resize flags it also converts to 16bit color, at least when used against 1bit (Black and White) image.
The reason this is important to note is that using -compress Group4 will not work on these images because they aren't 1bit color images and they need to be. To work around this limitation you need to force the color depth with -monochrome. The downside to all of this is time.
Ripping an Image file from a PDF takes roughly .206 seconds for an 8.5x11 PDF with pdfimages (useful if a PDF has OCR embedded in it.)
Converting the resultant PBM file without -geometry 1700x2200! -monochrome takes roughly .194 seconds.
Converting the resultant PBM file with -geometry 1700x2200! -monochrome takes roughly 4.594 seconds. This is an increase of 10 - 10.5 % adding in the geometry.
*all of the above numbers are from one file, but testing of different files showed similar results. All tests where done at 200 DPI.
Here are some examples of the commands we are running for anyone curious.
convert ${outputTiffRoot}-000.p*m -density 200 -compress Group4 {outputTiffRoot}_200.tiff
convert ${outputTiffRoot}-000.p*m -density 300 -compress Group4 {outputTiffRoot}_200.tiff
convert ${outputTiffRoot}-000.p*m -density 200 -compress Group4 -geometry 1700x2200! -monochrome ${outputTiffRoot}_200.tiff
convert ${outputTiffRoot}-000.p*m -density 300 -compress Group4 -geometry 2550x3300! -monochrome ${outputTiffRoot}_300.tiff
The reason this is important to note is that using -compress Group4 will not work on these images because they aren't 1bit color images and they need to be. To work around this limitation you need to force the color depth with -monochrome. The downside to all of this is time.
Ripping an Image file from a PDF takes roughly .206 seconds for an 8.5x11 PDF with pdfimages (useful if a PDF has OCR embedded in it.)
Converting the resultant PBM file without -geometry 1700x2200! -monochrome takes roughly .194 seconds.
Converting the resultant PBM file with -geometry 1700x2200! -monochrome takes roughly 4.594 seconds. This is an increase of 10 - 10.5 % adding in the geometry.
*all of the above numbers are from one file, but testing of different files showed similar results. All tests where done at 200 DPI.
Here are some examples of the commands we are running for anyone curious.
convert ${outputTiffRoot}-000.p*m -density 200 -compress Group4 {outputTiffRoot}_200.tiff
convert ${outputTiffRoot}-000.p*m -density 300 -compress Group4 {outputTiffRoot}_200.tiff
convert ${outputTiffRoot}-000.p*m -density 200 -compress Group4 -geometry 1700x2200! -monochrome ${outputTiffRoot}_200.tiff
convert ${outputTiffRoot}-000.p*m -density 300 -compress Group4 -geometry 2550x3300! -monochrome ${outputTiffRoot}_300.tiff
Thursday, December 16, 2010
Gawker Media Account Database hack
I'm sure you have heard about the release of about 1.5 million username / password combinations (encrypted with DES). I have gotten e-mails from a few web companies saying that I should re-set my password. These companies include LinkedIn and Blizzard (for my World of Warcraft account).
Since my roommate didn't get an e-mail from Blizzard (as he doesn't have an account on any Gawker Media website) and I did, I can only assume that Blizzard downloaded the hacked account database and compared it to their account database. Any matches where to get this e-mail.
I honestly hope this is what happened and that Blizzard and LinkedIn didn't just randomly send out password reset e-mails. In this case the most responsible thing to do is download the file and cross reference it with your own data.
If you are wondering where you affected by this breach visit http://www.didigetgawkered.com/.
Yesterday I read both an Analysis of the hack and an Analysis of the Analysis. I am fairly certain that my password was unique in the database, but I do know that I used to use that password all over the place. A few months ago I started changing password and using KeePass to store them securely. I disagree with Wikidsystem's Analysis of the Analysis.
Yes, I was just as owned as the person using something insecure such as letmein or password. But the "owning" wasn't because of a weak password. Yes, I do have to copy and paste my passwords, but that doesn't make me a loser. I treat all of my online identities the same, as they are a representation of ME. The real losers are the ones that use any sort of username / password combinations on multiple sites. If you don't care that some sites might get hacked with the same username / password then fine, but I do. I want any potential fallout to be minimal.
Also, for things I truly care about, if a two-factor authentication mechanism is available I use it. The other thing more developers need to account for is LONGER passwords. My pseudo-random password generator generates long passwords, sometimes too long for an account. Please make the password field huge and don't store it in plain text. I hate having to cut down a password from 30+ characters to 8 because that is the longest your application will allow.
You see I don't care if my password is 30+ characters, because I don't need to remember it! Thats what I have KeePass for!
Since my roommate didn't get an e-mail from Blizzard (as he doesn't have an account on any Gawker Media website) and I did, I can only assume that Blizzard downloaded the hacked account database and compared it to their account database. Any matches where to get this e-mail.
I honestly hope this is what happened and that Blizzard and LinkedIn didn't just randomly send out password reset e-mails. In this case the most responsible thing to do is download the file and cross reference it with your own data.
If you are wondering where you affected by this breach visit http://www.didigetgawkered.com/.
Yesterday I read both an Analysis of the hack and an Analysis of the Analysis. I am fairly certain that my password was unique in the database, but I do know that I used to use that password all over the place. A few months ago I started changing password and using KeePass to store them securely. I disagree with Wikidsystem's Analysis of the Analysis.
Yes, I was just as owned as the person using something insecure such as letmein or password. But the "owning" wasn't because of a weak password. Yes, I do have to copy and paste my passwords, but that doesn't make me a loser. I treat all of my online identities the same, as they are a representation of ME. The real losers are the ones that use any sort of username / password combinations on multiple sites. If you don't care that some sites might get hacked with the same username / password then fine, but I do. I want any potential fallout to be minimal.
Also, for things I truly care about, if a two-factor authentication mechanism is available I use it. The other thing more developers need to account for is LONGER passwords. My pseudo-random password generator generates long passwords, sometimes too long for an account. Please make the password field huge and don't store it in plain text. I hate having to cut down a password from 30+ characters to 8 because that is the longest your application will allow.
You see I don't care if my password is 30+ characters, because I don't need to remember it! Thats what I have KeePass for!
Thursday, October 14, 2010
Enabling Promiscuous Mode on vSphere 4
We are in desperate need of a testing server. The testing server needs to be able to listen to the network, through port mirroring, to record VoIP calls. In the physical world this is no problem, but we don't have the budget for another physical box, especially for something as non-critical as testing a program upgrade (even though the program it self is very critical to our business).
A year ago the software vendor said that they don't support virtual environments and their product doesn't work in a virtual environment. During discussions this year however they told the truth that they simply don't know if it will work, and thus "don't support" it. I am calling it lazy. It doesn't take much these days to get a VM host going and configured for testing things out.
Well we have done the leg work for them. I have confirmed that vSphere does allow for promiscuous mode, even from the physical network. To be honest I was a little shocked to see this worked.
Here are the steps to enable promiscuous mode on your vSphere host and the guest VM.
We enable promiscuous mode on the virtual adapter by logging into the vSphere Client, going to the VM Host, clicking on the "Configuration" tab, then on "Networking" in the "Hardware" section on the left. Now click on "Properties..." for the Virtual Switch.

Now enabling promiscuous mode on the vSwitch is pretty simple. Click on the "vSwitch" on the "Ports" tab, as shown below and then click on the "Edit..." button.

Now that we are editing the vSwitch properties click on the "Security" tab. Change the option for Promiscuous mode to "Accept" if it isn't already and hit "OK".

To enable promiscuous mode for the guest we need to break down to the command line. I used putty to SSH into my vSphere host, which I had previously setup. Now you need to edit the .vmx file of the guest that will be listening to the network.
# vi /vmfs/volumes/datastore1/testServer/testServer.vmx
I did a search for ethernet, so the promiscuous mode configuration would be with the rest of the ethernet config. Add the following line to the configuration file:
ethernet0.noPromisc = "FALSE"

And save when you are done. I rebooted my testServer just as a precaution, but I'm not certain it is required.
At this point everything is configured on the VM side of things. Make sure you have port mirroring enabled on your physical switch and give it a test. In my environment I commonly use Wireshark. I did my testing by pinging a server on a mirrored port.

A year ago the software vendor said that they don't support virtual environments and their product doesn't work in a virtual environment. During discussions this year however they told the truth that they simply don't know if it will work, and thus "don't support" it. I am calling it lazy. It doesn't take much these days to get a VM host going and configured for testing things out.
Well we have done the leg work for them. I have confirmed that vSphere does allow for promiscuous mode, even from the physical network. To be honest I was a little shocked to see this worked.
Here are the steps to enable promiscuous mode on your vSphere host and the guest VM.
- Enable promiscuous mode on the virtual adapter.
- Enable promiscuous mode on the vSwitch.
- Enable promiscuous mode for the guest.
- Enable port mirroring on the physical switch (not covered here).
- Test capturing network data.
We enable promiscuous mode on the virtual adapter by logging into the vSphere Client, going to the VM Host, clicking on the "Configuration" tab, then on "Networking" in the "Hardware" section on the left. Now click on "Properties..." for the Virtual Switch.

Now enabling promiscuous mode on the vSwitch is pretty simple. Click on the "vSwitch" on the "Ports" tab, as shown below and then click on the "Edit..." button.

Now that we are editing the vSwitch properties click on the "Security" tab. Change the option for Promiscuous mode to "Accept" if it isn't already and hit "OK".

To enable promiscuous mode for the guest we need to break down to the command line. I used putty to SSH into my vSphere host, which I had previously setup. Now you need to edit the .vmx file of the guest that will be listening to the network.
# vi /vmfs/volumes/datastore1/testServer/testServer.vmx
I did a search for ethernet, so the promiscuous mode configuration would be with the rest of the ethernet config. Add the following line to the configuration file:
ethernet0.noPromisc = "FALSE"

And save when you are done. I rebooted my testServer just as a precaution, but I'm not certain it is required.
At this point everything is configured on the VM side of things. Make sure you have port mirroring enabled on your physical switch and give it a test. In my environment I commonly use Wireshark. I did my testing by pinging a server on a mirrored port.
Using PSExec to Defragment your PCs
Way back in 2000 / 2001 I was an IT intern. My job was to do the really manual processes for a small department with in a much larger company. One of those was monthly defrags of all PCs and Laptops (if they where available). I had to go to each and every PC, log on, and start the defrag process manually. I believe this to be my first moment of "I should automate this". Problem was I didn't know how or really where to start. I knew script was the answer, but just couldn't get things to work. I believe I eventually created a scheduled task on each machine (by hand) to do this for us.
Fast forward 10 years and I am still in need of the same thing, as we don't have Vista or Windows 7 deployed. But now I have a much better understanding of what needs to happen and even better I know where to start!
PSExec, which is part of the System Internals PsTools suite is my answer these days. A simple script, run from my PC (still manually for the time being) is able to handle defragmenting all of our PCs.
psexec @C:\Updates\Comps\AppPCs.txt -n 10 -c -f -d JkDefragCMD.exe
I use the files with PC names to speed up re-deployment of everything. The -n 10 flag tells psexec t0 wait 10 seconds before it times out the PC, instead of 60 (I believe this is the default). -c copies the file (jkdefragcmd.exe) to the remote system. The flag -f forces copying, even if the file exists. The flag -d doesn't wait for the process to terminate, this is as asynchronously as I can do.
My next step is to hook this up to task scheduler and have it run the first Sunday or something.
Fast forward 10 years and I am still in need of the same thing, as we don't have Vista or Windows 7 deployed. But now I have a much better understanding of what needs to happen and even better I know where to start!
PSExec, which is part of the System Internals PsTools suite is my answer these days. A simple script, run from my PC (still manually for the time being) is able to handle defragmenting all of our PCs.
psexec @C:\Updates\Comps\AppPCs.txt -n 10 -c -f -d JkDefragCMD.exe
I use the files with PC names to speed up re-deployment of everything. The -n 10 flag tells psexec t0 wait 10 seconds before it times out the PC, instead of 60 (I believe this is the default). -c copies the file (jkdefragcmd.exe) to the remote system. The flag -f forces copying, even if the file exists. The flag -d doesn't wait for the process to terminate, this is as asynchronously as I can do.
My next step is to hook this up to task scheduler and have it run the first Sunday or something.
Monday, October 04, 2010
Enabling the Administrator user in Windows 7
This is a very simple fix. The reasons to actually log on as the administrator are shrinking, but for my environment I need to log on as the Administrator user occasionally (for software patching).
- Open up a command prompt as Administrator (not the same thing we are trying to do)
- Run "net user /active:yes administrator"
- Now it is a great idea to set a password for the Administrator user so we can do that right now
- Run "net user administrator password" but replace password with something more complex similar to "Som3C0mpl3xP@$$w0rd"
- Exit out of the command prompt.
Monday, September 13, 2010
How to Reset the Password(s) on a Linksys SRW248G4 Switch
- Connect to the Serial port on the back of the switch with a serial cable. (Putty on Windows works well)
- The defaults for connecting to the serial port are 38400 baud, 8 data bits, no parity, 1 stop bit, no flow control.
- Confirm that you have an active serial connection by pressing enter a couple of times. You should receive a login screen
- Once you have successfully connected to the serial port restart the switch by unplugging the power. (Either from back or from the power strip, my preferred method is the back)
- The switch will start its POST process.
- Look for the line “Autoboot in 2 seconds - press RETURN or Esc. to abort and enter prom.” (Please note: Do not hold down Esc. or Enter. Only press it once.)
- You will know that you interrupted the boot sequence when you are prompted with a startup menu. Select option 3 “Password Recovery Procedure”.
- The screen will display “The current password will be ignored!”. Press Enter to reboot the switch.
- Once the switch has restarted login with the default admin user and no password. This will work on either the terminal or the web interface. Proceed to create / modify users and passwords. This does not reset the rest of the configuration, just user accounts.
- Once you have your new credentials reboot the switch again. Document the credentials.
- Verify that your new credentials work by logging into either the web interface for the command line interface.
- Disconnect the cable and store it safely.
Thursday, August 19, 2010
Rebuilding the Icon Cache in Windows 7 (and Vista)
If you ever need to rebuild the Icon Cache and dearly miss TweakUI for this duty there are three simple command lines to run and a process to kill and then start.
1. Open Task Manager
2. Kill all explorer.exe processes (but leave Task Manager Open)
3. Open a command prompt
4. type "CD /d %userprofile%\AppData\Local"
5. type "DEL IconCache.db /a"
6. type "Exit"
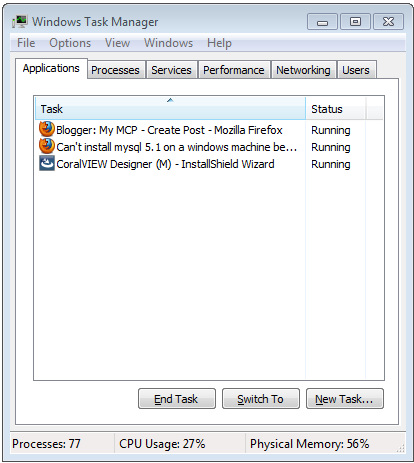
7. Go to Applications Tab in Task Manager and click the "New Task..." button.
8. type "explorer.exe"
1. Open Task Manager
2. Kill all explorer.exe processes (but leave Task Manager Open)
3. Open a command prompt
4. type "CD /d %userprofile%\AppData\Local"
5. type "DEL IconCache.db /a"
6. type "Exit"
7. Go to Applications Tab in Task Manager and click the "New Task..." button.
8. type "explorer.exe"
Subscribe to:
Posts (Atom)